Unlock the full potential of your data

Turn complex data into clear, actionable insights to drive smarter decisions
for your business.
Schedule your free data analytics strategy call

End Spreadsheet Struggles - Focus on What Matters

Is your team drowning in data but starved of insights?
Let us help you transition from manual reporting to data-driven action, fast.

Get the right data for each level in your business

Whether you need high-level trends or detailed breakdowns, our tailored visualisations ensure that each level of your organisation gets the insights they need - without complexity.

Directors

Quick overviews and trends for strategic planning.

Managers

Track performance and identify areas for improvement.

Analysts

Get detailed data that's easy to manipulate and explore.

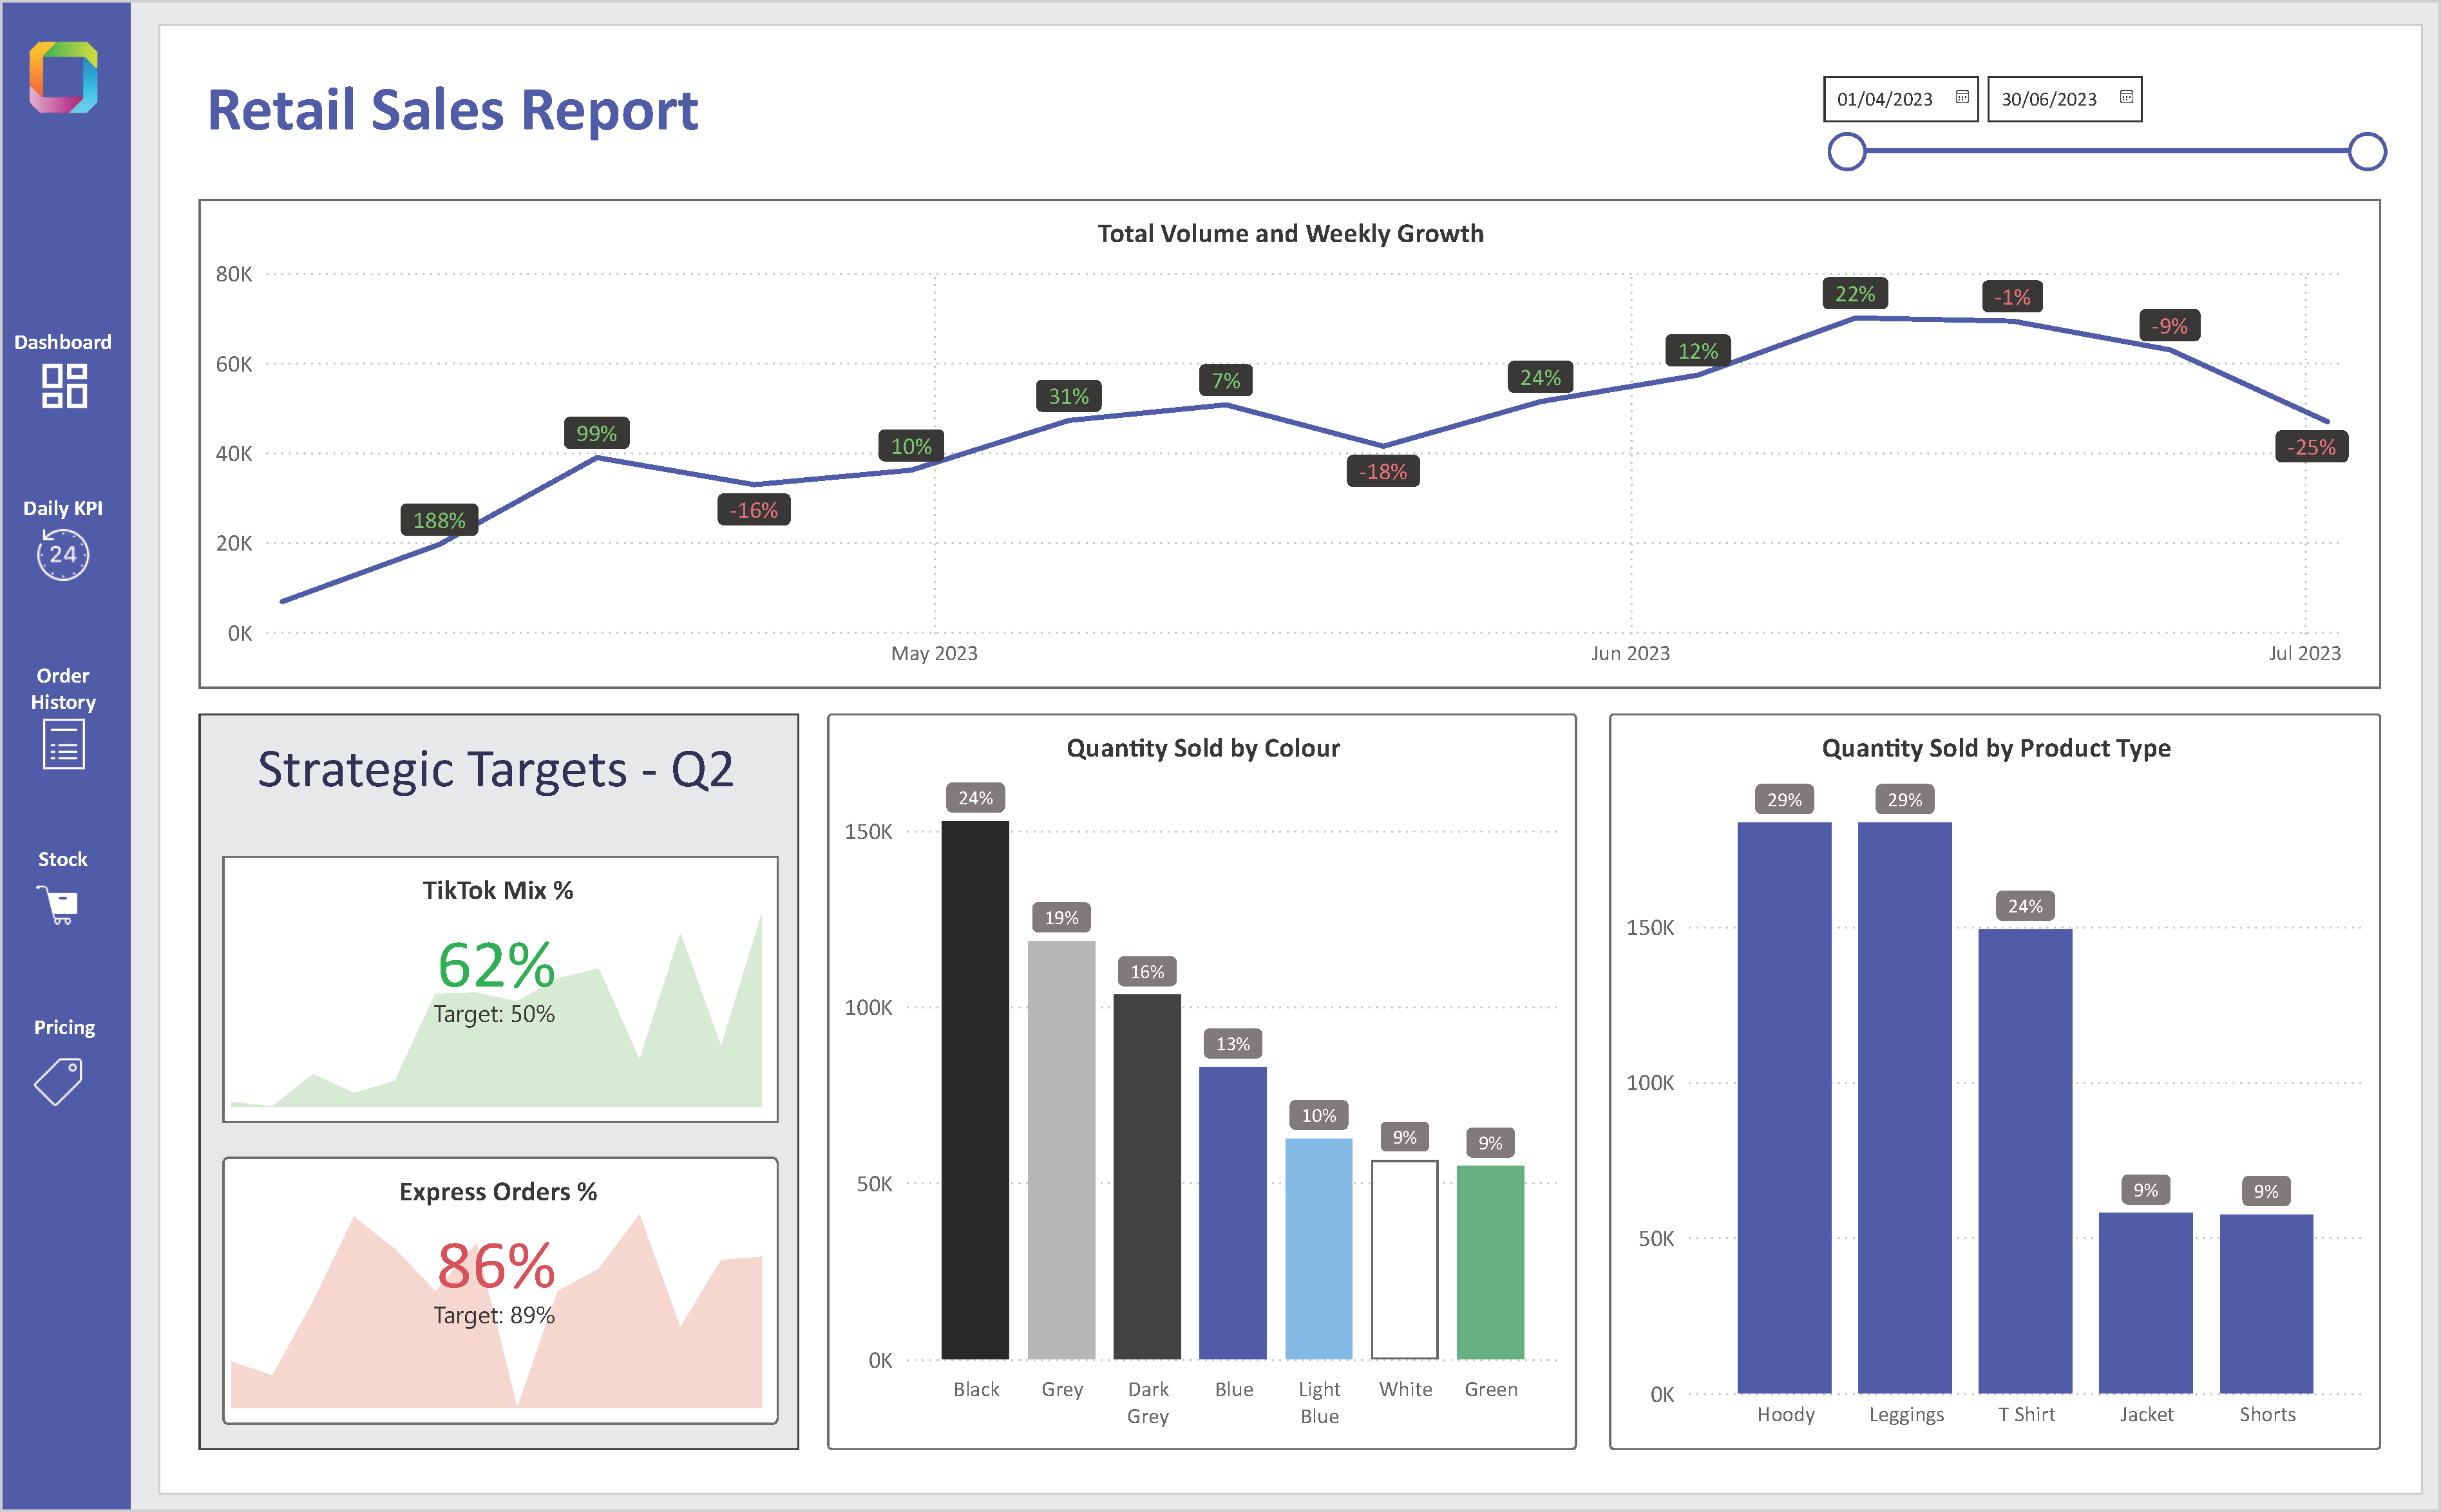
See it in action

Check out our live example. Visualising data across different stakeholders within your business.

Review from Jonathon, Founder at GiveAShift.co

“Issy at OnMetrix was super helpful in putting clarity into our data. As a start up it is essential to understand your price economics and OnMetrix made an interactive dashboard which is easy to use and adjustable, meaning we have a scalable solution that will help us make key decisions moving forward.

Issy understood the task immediately and offered up invaluable advice and recommendations which hadn't previously been considered.

If you're looking to get more insight out of your numbers, I wouldn't hesitate to recommend OnMetrix.”

Check out the benefits achieved in these case studies

CASE STUDY
Financial Reporting

We implemented new Power BI reporting within an organisation where the finance team previously reported on KPIs and financial metrics monthly using numerous Excel spreadsheets. This process took them, on average, two days to complete the full reporting pack and was prone to human error and time delays. We replaced this process with a Power BI report that becomes available immediately after the month-end data is updated. This change allows the team to use those two days to add value through analysis and actions to improve KPIs, rather than spending time on manual collation.

CASE STUDY
Operational Reporting

The pricing team struggled to visualise their competitiveness against the market and key competitors due to the volume of data. We used their data to build a comprehensive Power BI report, providing insights into areas of concern, market competitiveness, and where they lead the market. This report updates daily for new market data and is available before 9 am, enabling the team to respond swiftly to market changes and ultimately improve customer satisfaction.

See the Impact of Powerful Visualisations

Explore our custom reports and see how we turn complex data into clarity, helping businesses like yours thrive.
Transform Your Data Today

Book a Free Consultation

Why OnMetrix?
Simple, Impactful Data Solutions

With OnMetrix, you're not just getting dashboards - you're getting clarity and confidence.

We don't just create dashboards; we craft data solutions that give you the clarity
to make strategic decisions with confidence.

Frequently Asked Questions

We provide tailored reporting solutions, from comprehensive suites that unify all your data to specific analytics that offer daily or weekly insights tailored to your needs.

We've been there, we know what it's like to come into work in a morning and start importing the latest data and refreshing Excel reports. This is exactly where we can help with automating this process so that insights are available as soon as you log on.

This is normal, you aren't alone! Power BI can connect to many different sources of data such as Azure databases, SQL databases, Salesforce and so many more. We can definitely help, and it won't take months either!

We certainly can! If you are looking for additional data to provide new insights such as weather data or competitor data then we can access this and build new analytics which will help drive your business strategy.

We work with you from the outset to understand the report requirements, scope, stakeholders and what insight is needed to help you make better decisions. This process won't take long and then our team will start the build. We link in often to ensure we have understood your requirements and to make sure that we are on track. You are the experts of your business. We then deliver and provide any training you need to get using the report right away. The whole process can take as little as 2-3 weeks from initial call to delivery.

We offer ongoing support and training, ensuring your team maximises the value of your reports. We can also host your solution and provide insights and analytics to support your reports.

Absolutely! Power BI is scalable and adapts to your growing needs, allowing your reports to evolve as your business grows.